Comparison of outcomes classical and novel forecasting tools
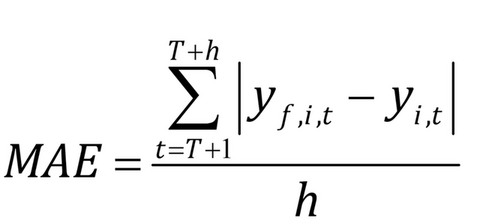
To evaluate the predictive power of various competing forecast models, we use two commonly applied metrics for evaluating forecasts, i.e. Root Mean Squared Error (RMSE), the Mean Absolute Error (MAE)
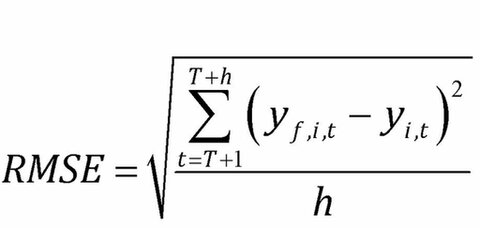
with y,f, i,t the forecast of yi,t and h the forecast horizon
Comparison of RMSE and MAE for various models
| RMSE | MAE | ||
| 14.34 | 9.54 | |
| 3.79 | 1.95 | |
| ME model with country-specific intercepts and general trend, squared trend and lagged acreages | 4.75 | 3.51 | |
| MERF model with country-specific intercepts and trend in RF | 14.30 | 6.98 | |
| MERF model with country-specific intercepts and trend, squared trend and lagged acreages in RF | 2.85 | 1.32 | |
| Random Forest (RF) model with country-specific intercepts and trends, general squared trend and lagged acreages | 3.86 | 1.72 |
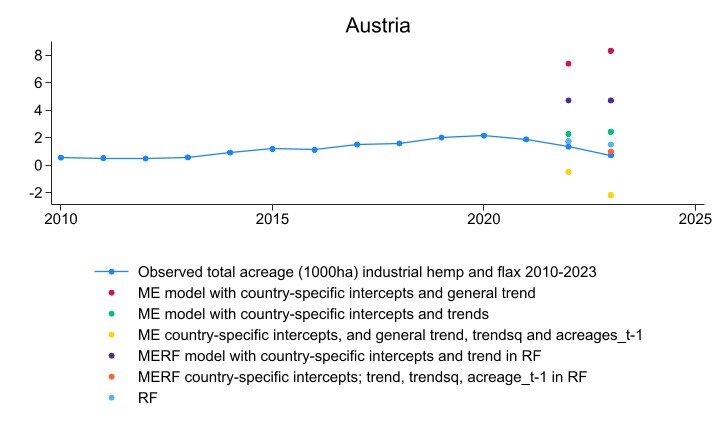
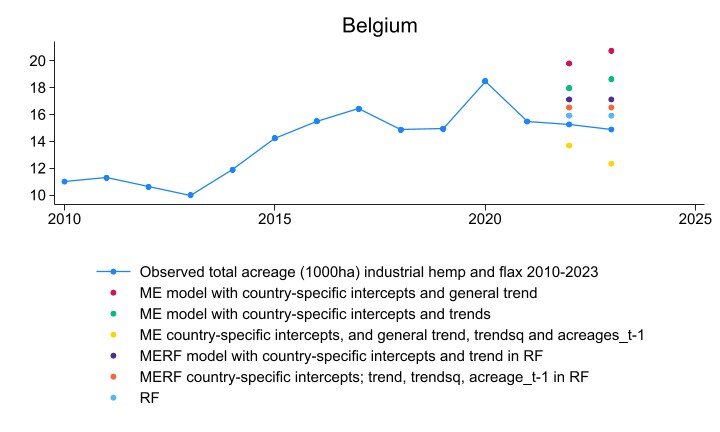
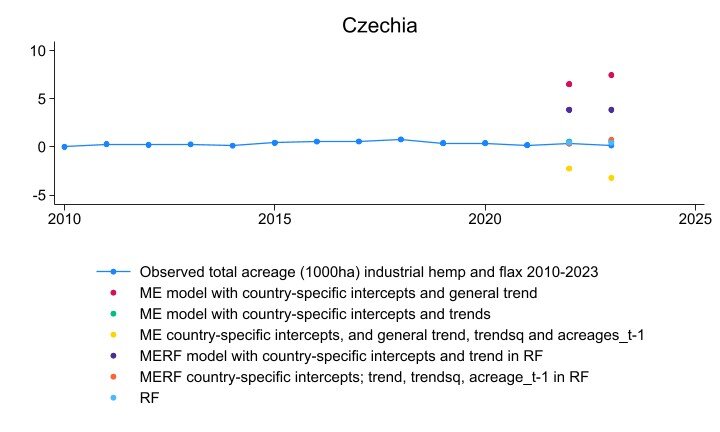
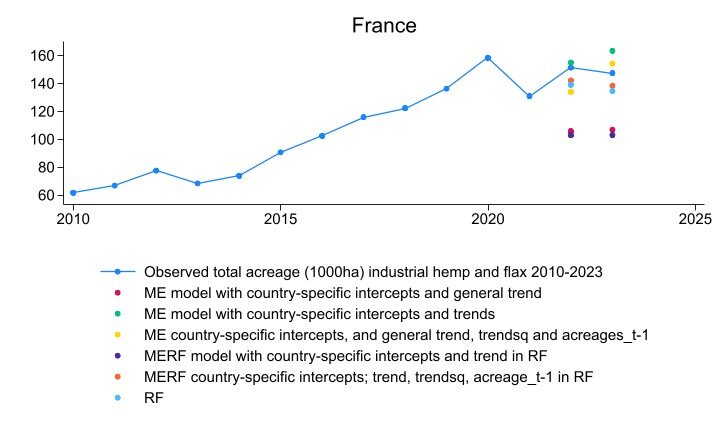
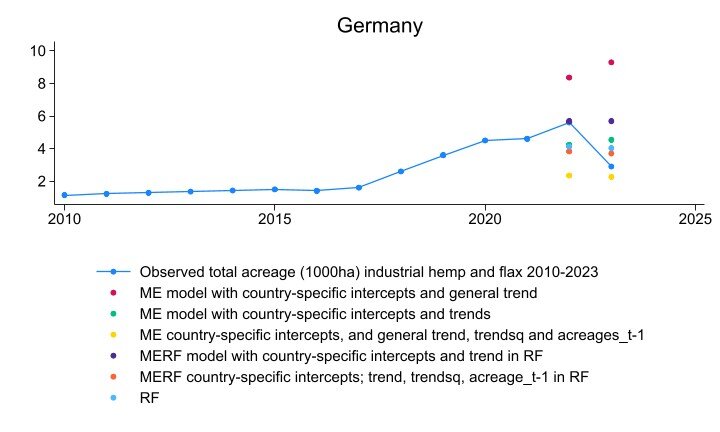
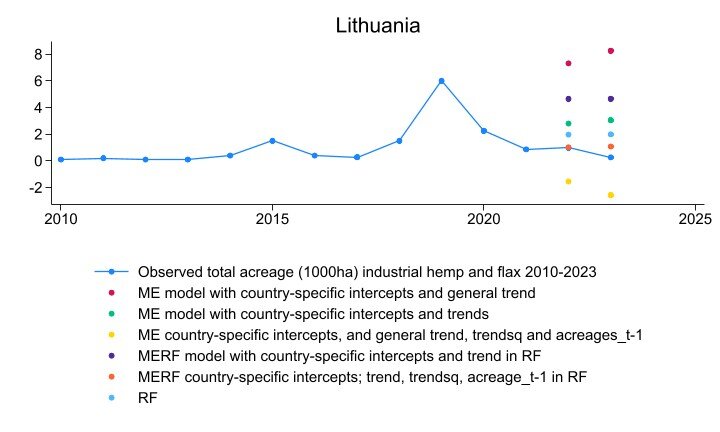
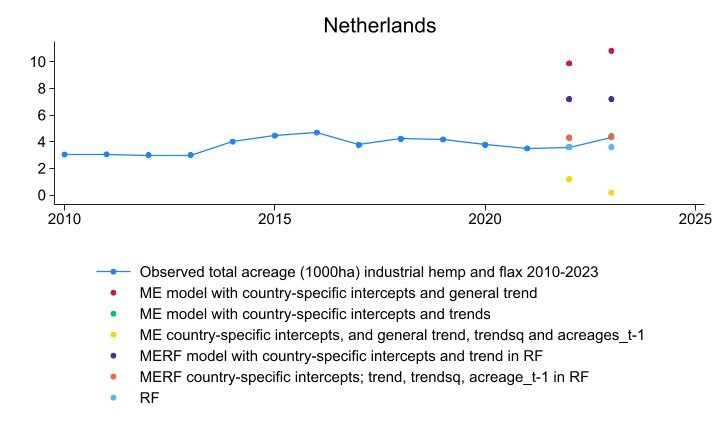
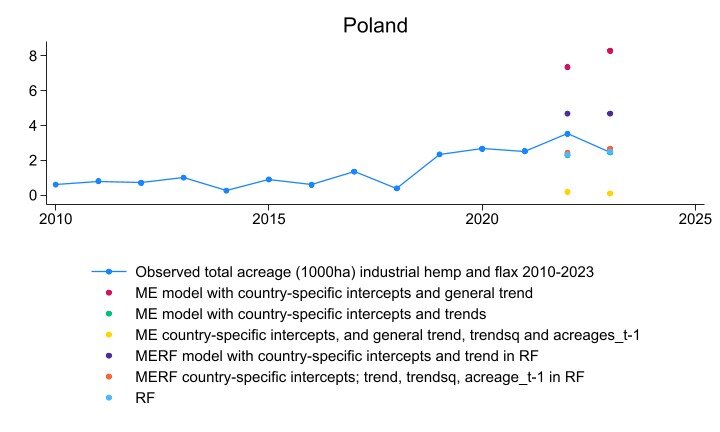
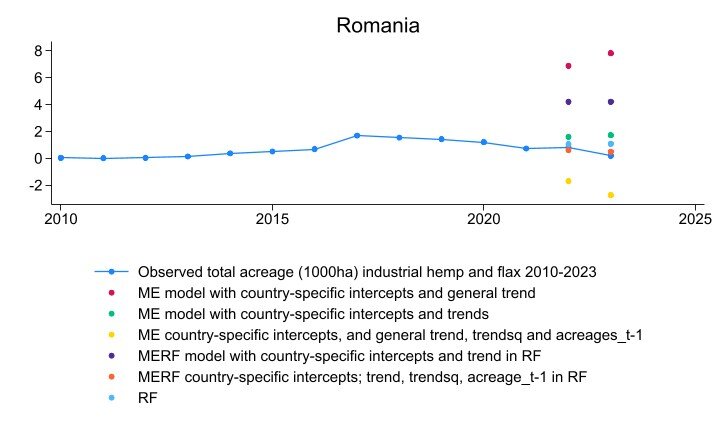
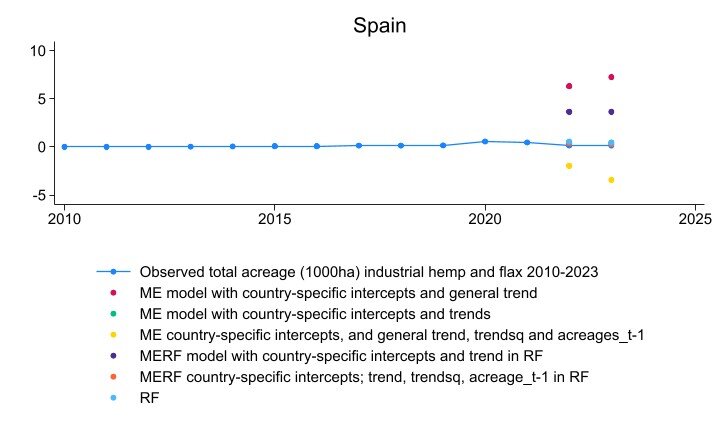
Besides these metrics we can also visually compare the forecasts of various method.
The combination of a classic Mixed Effects model with a machine learning Random Forest performs best, since it combines the strength of the ME model to exploit the country specificity, with the superior forecasting capability of the random forest.